
Patexia Patent Insight 20: Patent Issuance Levels Hold Steady Through 2025
Raw numbers often say more than commentary. In patent prosecution, issuance data provides one of the clearest signals of how much innovative activity is actually making its way through the system. Unlike filings, which can reflect short-term strategy shifts, issued patents represent applications that have survived examination, negotiation, and amendment. Looking at issuance totals over time helps ground broader discussions about innovation, enforcement, and future disputes.
Yearly Patent Issuance Trends
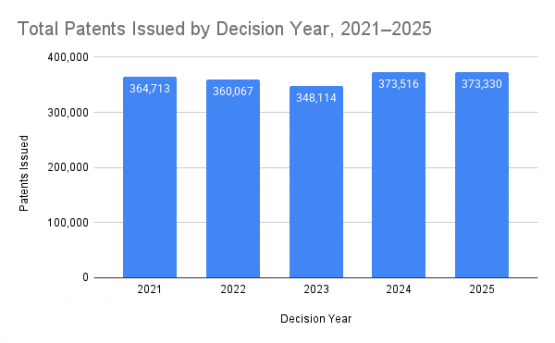
With 2025 now complete, patent issuance data offers a useful snapshot of how the U.S. patent system has been operating in recent years and whether activity is accelerating, slowing, or settling into a more stable pattern. The chart below shows the total number of patents issued by decision year from 2021 through 2025.
In 2023, the USPTO issued 348,114 patents, the lowest point in the five-year period. That figure increased substantially in 2024 to 373,516 patents and held steady in 2025 at 373,330 patents. The near-identical totals in the last two years suggest that patent-granting activity has stabilized at a relatively high level following the post-2023 rebound.
Quarterly Issuance Reveals a Mid-Year Surge
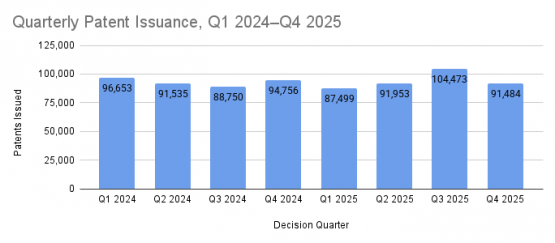
Looking more closely at issuance on a quarterly basis reveals additional differences behind the annual totals. As shown above, patent grants fluctuated throughout 2024 and 2025, with a notable increase in the third quarter of 2025. After a relatively modest start to the year, issuance climbed steadily through Q2 before peaking in Q3 2025 at 104,473 issued patents, the highest quarterly total in the eight-quarter period shown. Activity then eased in Q4, returning closer to the levels seen earlier in the year. This Q3 spike suggests a period of accelerated examination and grant activity, helping to explain why overall issuance in 2025 remained elevated despite variability across individual quarters.
Interpreting the Trend
Several factors may be contributing to this sustained issuance volume. Improvements in examination throughput, efforts to reduce backlog, and consistent filing activity from large corporate applicants have likely played a role. At the same time, steady issuance numbers point to continued investment in research and development across technology sectors, even as economic conditions and enforcement strategies evolve.
Importantly, stable issuance does not mean uniform behavior across all applicants or technologies. Aggregate totals can mask shifts in who is receiving patents, which industries are most active, and how prosecution strategies are changing beneath the surface. For a deeper look at patent prosecution activity, our upcoming Patent Intelligence Report will provide a detailed, data-driven analysis of issuance trends, including the most active applicants, technology areas with the highest grant volumes, and changes in prosecution behavior over time.
More insights
Does the Uspto Issue Secret Patents on Aerospace Innovations
Written by : Tom Cowan Key Takeaways : Despite periodic mentions by aerospace innovators of “secret patents,” this author is not aware of any evidence of such patents. There may be confusion with “Secrecy Orders,” which apply to…
Life Science Considerations on the Uspto S New Guidelines for Ai Assisted Inventorship
Written by : Robert J. Hilton, Ph.D. and Susan M. Janicki, Ph.D. On November 26, 2025, the United States Patent and Trademark Office (USPTO) issued revised guidelines for determining inventorship of AI-assisted inventions, [1] which is a significant…
Uspto S Automated Search Pilot Through a Biotech Lens
Written by : Jason J. Jardine and Geetha Durairaj, Ph.D. In October 2025, the U.S. Patent and Trademark Office (USPTO) launched the “ Artificial Intelligence Search Automated Pilot Program ,” or ASAP!, an initiative to identify potential prior…